Whole vs. H&G vs. Fillet Yield Calculations in Seafood Pricing
Correct yield calculations protect distributor margins across three processing forms.
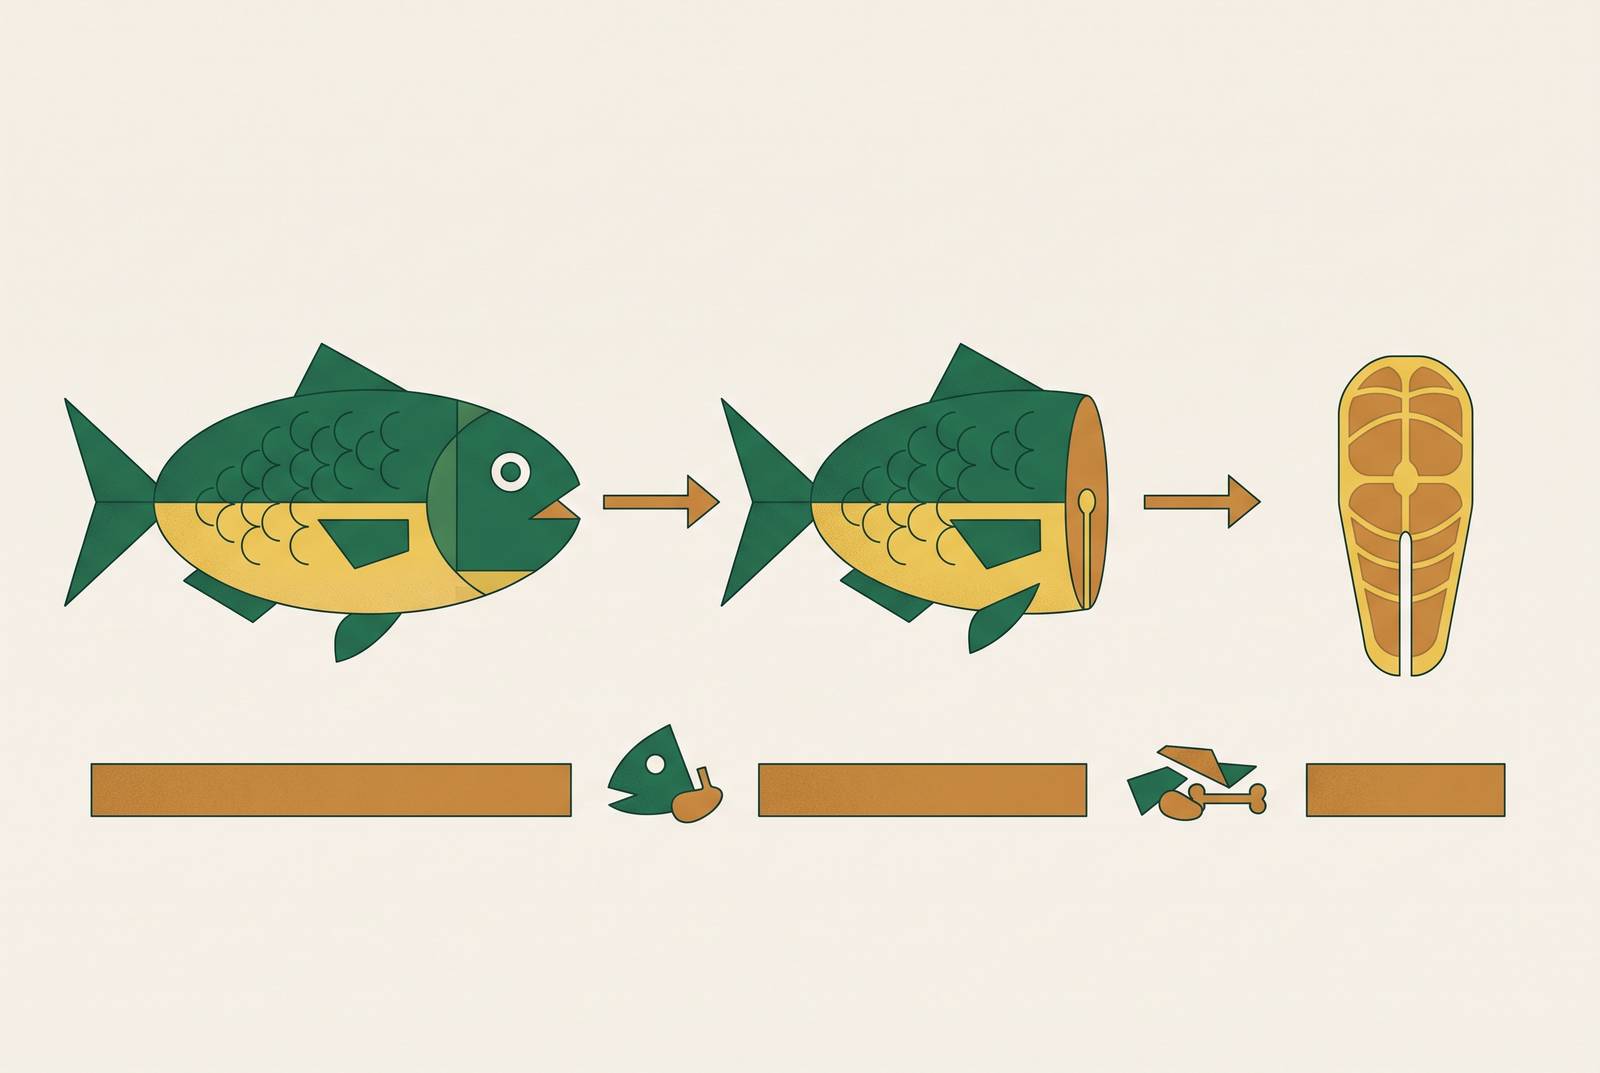
Whole fish, headed-and-gutted fish, and fillets are three different starting weights with three different loss curves. They're three different starting weights with three different loss curves, and a price quoted on one form tells you almost nothing about cost on another unless you run the conversion math correctly. Get the yield cascade wrong, and a distributor can quote a customer competitively on paper while bleeding margin on every case that ships.
The terminology itself carries the risk. WR (whole round) means the fish as it came out of the water: head on, guts in, scales intact. H&G means headed and gutted, the workhorse form of most distributor trade, where the skin and bones stay put but the head and viscera are gone. Fillet is the form people actually put a fork into, sold skin-on or skin-off (S/O or S/Off), with or without pin bones (PBI or PBO). IQF, J-cut, and V-cut abbreviations start doing real work in a purchase order. Misread one of them on an ERP item master, and the yield math is broken before anyone opens a calculator.
The core yield formula and how to apply it across forms
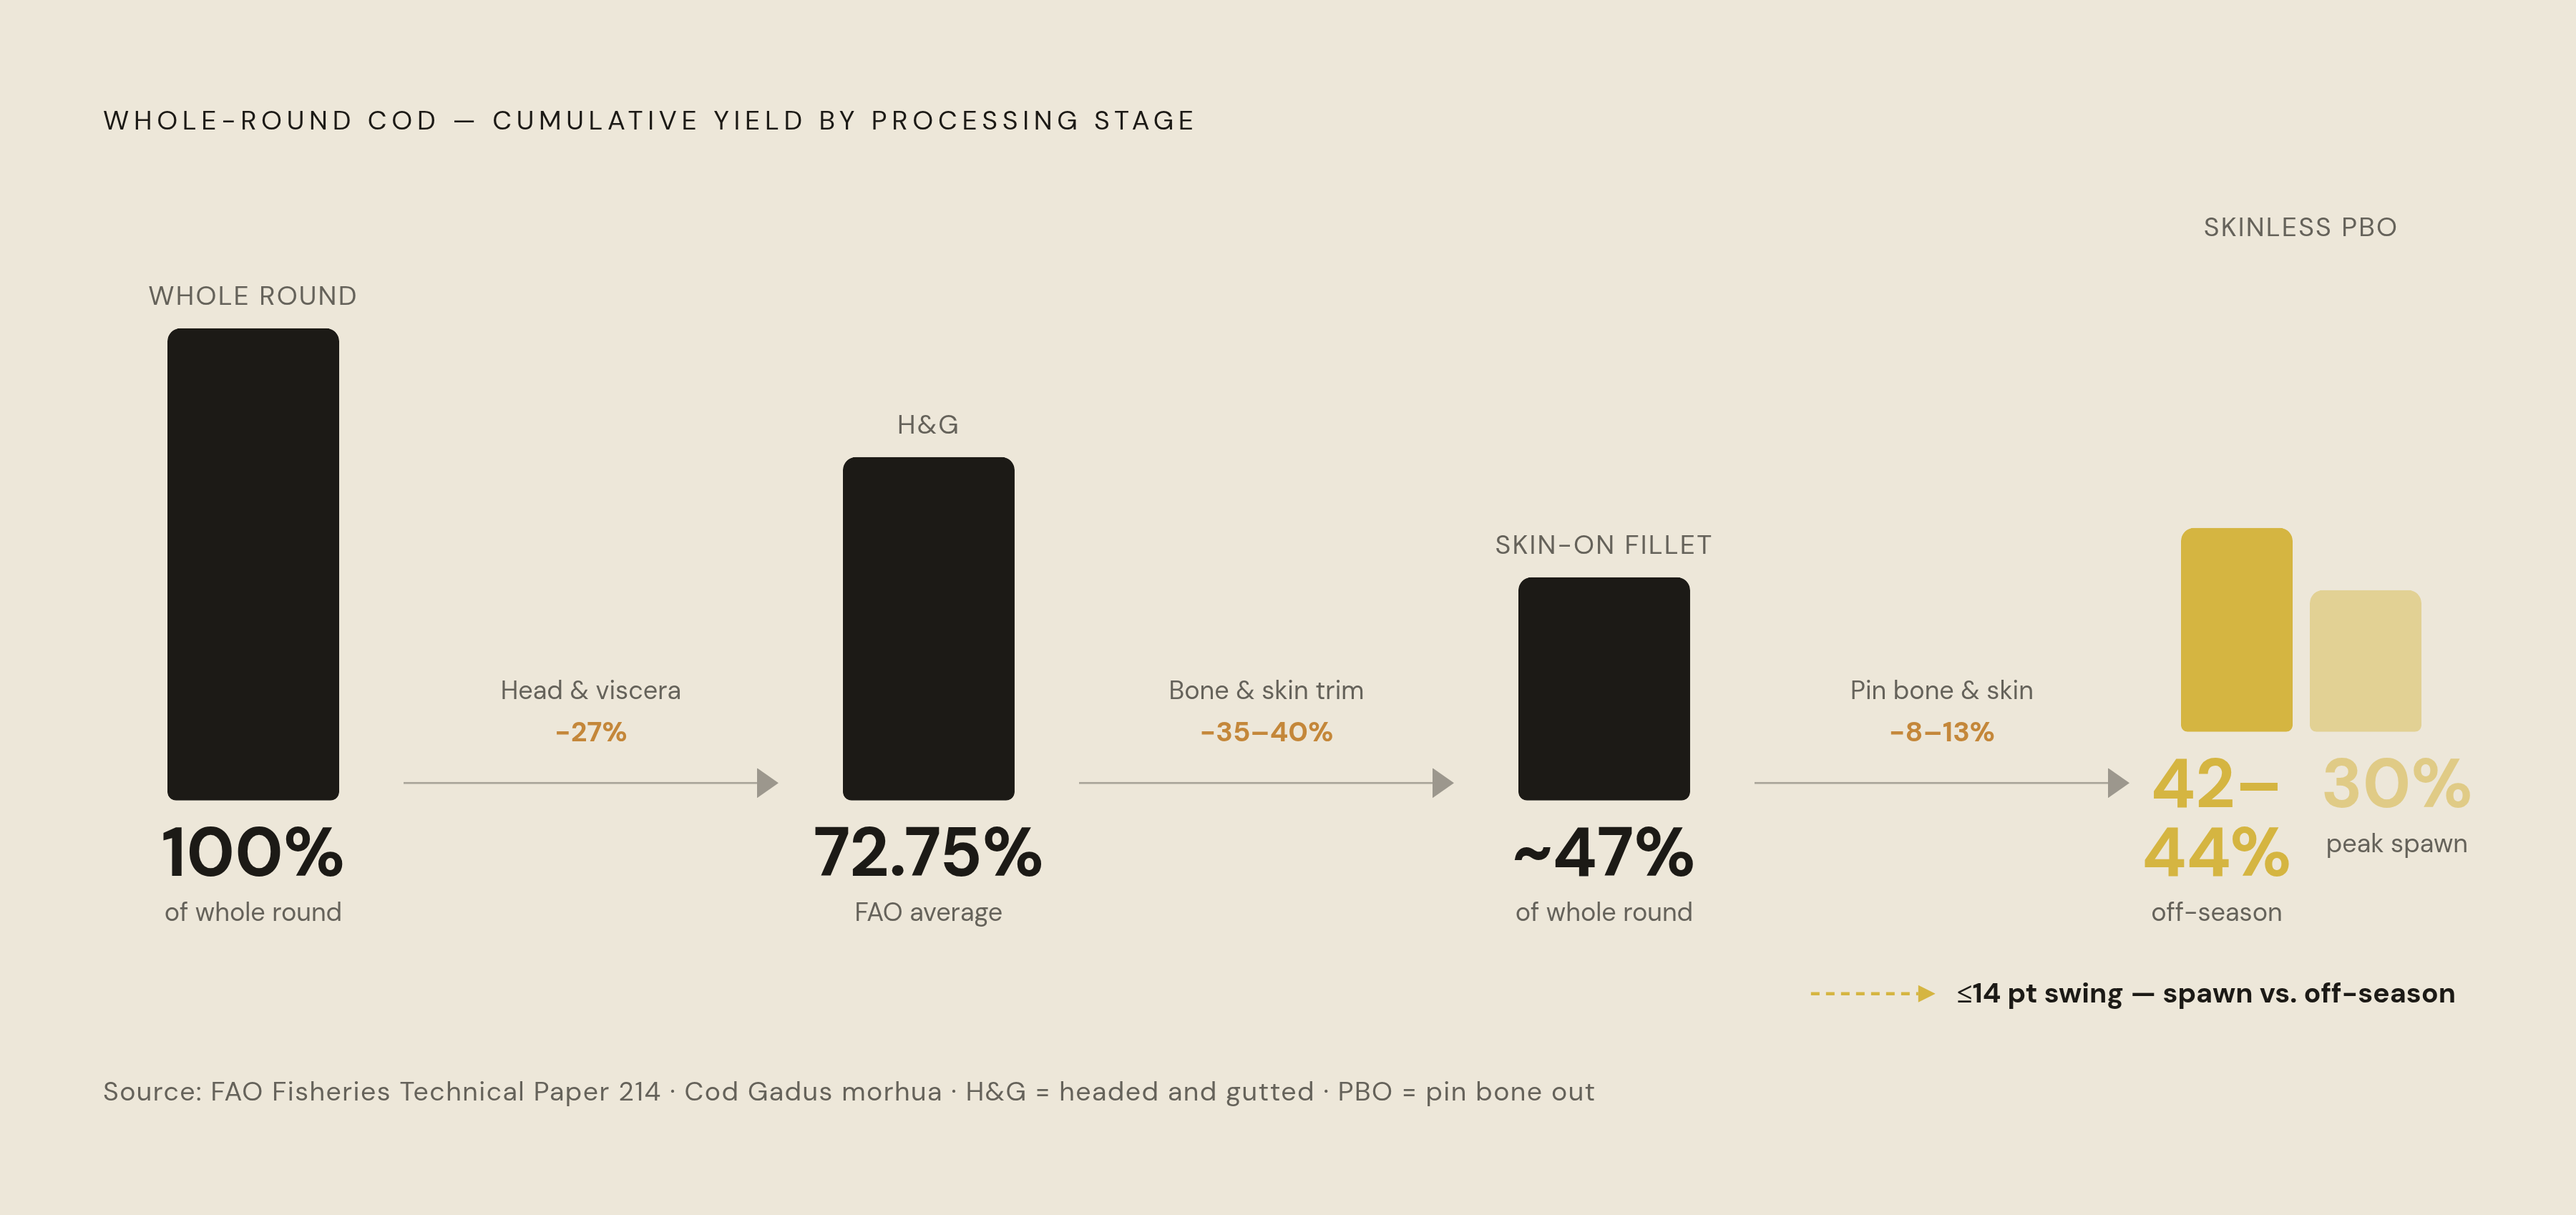
The formula is complicated only in that it gets skipped under time pressure. Convert the yield percentage to a decimal, then divide the usable weight you need by that decimal. Need 10 pounds of fillet at a 75% yield rate? That's 10 ÷ 0.75, or 13.33 pounds of whole fish to buy. The same logic holds moving from H&G to fillet: if H&G cod runs 42 to 44% usable skinless fillet, divide the fillet order by 0.43 to find the pounds of H&G product required to fill it.
What makes this a cascade rather than a single calculation is that most trade doesn't happen in one step. A distributor buying whole round and selling skinless fillet is running through at least two conversions, sometimes three, and each one has its own loss rate. Whole round to fillet is the longest path and the lowest overall yield, since it absorbs head, viscera, skin, and bone loss all at once. H&G to fillet is a shorter path, since the head and gut loss is already sunk into the H&G price, but skin, bones, and trim are still coming off. Skin-on to skin-off fillet is the shortest step in the chain, but skinning still costs somewhere in the range of 3 to 5% of weight, and that's before anyone touches the pin bones.
Pin bone removal adds its own toll. Pulling Y-bones knocks off another 4 to 8%, and moving all the way to skinless, boneless PBO product can cost 8 to 13% relative to a standard skin-on fillet. These losses lined up end to end show why quoting a "skinless PBO fillet price" off a whole-fish purchase price, without walking through every intermediate step, is really just a guess wearing a decimal point.
What the yield numbers look like by species and form
Salmon has the best-documented yield data of any commonly traded seafood, which makes it a useful anchor. Wild King (Chinook), whole round and undressed, runs about 46% to skin-off fillet. Move to King that's already head-off and gutted (H/Off) in the 10-Up size grade, and skin-on yield jumps to 72%, skin-off to 64%, because the head and gut loss has already been absorbed upstream. Farm-raised Atlantic in the 6/10 to 10/14 size range yields about 70% skin-on and 64% skin-off; move up to 18/Up fish and yield improves again, to about 72% skin-on and 66% skin-off. Bigger fish yield better, consistently, because a fixed-size head and skeleton take up a shrinking share of a growing body.
Rolled up, the salmon cascade runs something like this: whole wild fish to skin-off fillet is near 55%, head-on farmed gutted salmon to skin-off is around 63%, and skin-on to skin-off alone costs a modest share, since skin-off yield stays close to the skin-on weight. Push further into trim work, removing the deeper brown fat layer along the lateral line, and yield on gutted Atlantic salmon can slide from around 65% down to around 60%.
Cod tells a different story, and it's the species that makes the strongest case for tracking yield as a moving target rather than a fixed number. Head-on, gutted Atlantic cod converts to skinless PBO fillet at 42 to 44% during the non-spawning season. At spawning, that drops to 38%, and at peak spawn it can fall as low as 30%. That's a swing of more than 10 percentage points on the exact same species, form, and vendor relationship, driven entirely by biology. FAO data puts headed-and-gutted cod yield from whole fish at an average of 72.75%, but that figure describes the WR-to-H&G step, not the H&G-to-fillet step, and conflating the two is one of the more common ways this math goes wrong. PBI fillets are far less common than PBO in current trade, so a quote that specifies PBI is describing a functionally different product than the PBO fillet most buyers expect.
Snapper and grouper sit at the rough end of the yield spectrum, mostly because of head size. A 50% fillet yield on grouper or snapper is described in the trade as "right on the money," meaning it's the average outcome. Head-on snapper runs closer to 45% for skin-on fillets, since the head represents a disproportionate share of total weight on these species. Flounder and other flatfish sit even lower, closer to 35%, among the thinnest yields of any commonly traded form, so promising four dinner portions at 8 ounces apiece off a modest-sized flatfish order is risky.
The four variables that make published yield benchmarks a starting point, not a guarantee
Published yield tables are a reference point. Four variables push actual yield away from the benchmark, sometimes by a wide enough margin to matter on the invoice.
Size is the most mechanical of the four. A 10-pound fish yields a higher fillet percentage than five 2-pound fish of the same species, because head and skeleton mass stays roughly fixed while body mass scales up. Even within a single size grade, a 20-pound fish and a 21-pound fish of the same species can differ in yield by about 5 percentage points.
Season matters just as much, and cod is the clearest proof: a swing from 42 to 44% at rest down to 30% at peak spawn is not a rounding error. It's a structural shift in what the fish is made of. A distributor pricing cod fillet conversion at one flat number across twelve months of the calendar is pricing correctly for maybe half the year and bleeding margin the other half.
Sex plays a role too, particularly during spawning windows, since reproductive condition affects how fish mass converts to usable fillet weight. That's a real cost for anyone buying whole or H&G product during reproductive season, and it compounds the seasonal effect rather than sitting apart from it.
Then there's the cutter. Yield tables generally assume a trained fabricator, and the gap between a trained hand and an inexperienced one is not trivial once volume enters the picture: a smaller fish in less experienced hands can push actual yield well below the published benchmark, while more experienced filleters working the same fish tend to recover more usable weight. At scale, that gap between a good cutter and a mediocre one is real money moving in one direction or the other, every single day.
Yield gaps and margin erosion in real distributor pricing scenarios
Running these variables through an actual purchasing decision makes the risk stop being theoretical.
Consider a buyer comparing a whole-round cod quote against an H&G cod quote from a different vendor. Without converting both to a fillet-equivalent basis, using something like the FAO's 72.75% WR-to-H&G average as the conversion step, the buyer has no real way to know which offer is actually cheaper per usable pound. Picking the lower invoice price without doing that conversion is picking blind.
Consider a distributor that prices cod-to-fillet conversion at a flat 42% all year. That number is roughly correct outside spawning season and badly wrong during it, when actual yield can fall to 30 to 38%. Every pound of fillet sold in that window costs more to produce than the quote assumed, and because nothing on the invoice flags the shortfall, the margin erosion never gets a name. Because nothing on the invoice flags the shortfall, the margin erosion never gets a name, and it appears instead as a worse quarter than expected.
Consider a quote built on 10/Up King salmon, with its 72% skin-on yield, applied without adjustment to a shipment that actually arrives as 2/4 Kings at 68%. A yield gap of that size, applied across a substantial order, becomes a real dollar figure that never should have been left to chance.
And consider the billing practice where an operation invoices the whole fish weight and treats the filleting itself as a service line item. The customer, in that arrangement, is paying for head and gut weight it never receives as product. Whether or not that's disclosed, it changes what "price per pound" actually means, and that detail belongs explicitly in a contract rather than left to assumption.
Catch-weight pricing: why yield math and ERP reconciliation break down together
Whole fish and H&G product live in what the industry calls catch-weight territory: the commercial unit, a case or a piece, has a weight that cannot be pinned down at the moment of order. The transaction gets priced and ordered by unit count, but the invoice gets calculated against the actual weight measured at pick or delivery, not the estimate used to write the order.
That creates a dual-unit problem baked into the operation. The warehouse counts cases going out the door. The invoice bills pounds coming off the scale. There is no fixed, universal conversion between the two, because every case of whole fish or H&G product weighs something slightly different from the last one.
Layering yield math on top of that compounds the mismatch between quoted case weight and actual case weight. A distributor quotes a fillet-equivalent price built off an H&G purchase, using an average case weight as the basis for the conversion. If the actual case weights recorded on incoming orders land above or below that average, and there's no system tracking both the unit count and the actual weight against the yield assumption used in the quote, the fillet-equivalent cost the business is actually carrying either overcorrects or drifts unnoticed. Spreadsheets and manual logs are the wrong tool for holding two units reconciled at real order volume: the error rate scales with the volume moving through the operation, not with how many people are watching it.
Building a yield-adjusted pricing discipline into distributor operations
Fixing this starts with making the yield assumption explicit rather than implied. Every quote a distributor sends should state the form (WR, H&G, skin-on fillet, skinless PBO), the size grade, and, where the species calls for it, the season. That specification is the yield assumption, written down instead of left to guesswork on the receiving end.
From there, the next move is building a yield matrix specific to the distributor's own product mix rather than adopting published benchmarks wholesale. Published data from sources like Chefs Resources and FAO cover the core species and forms, but the figures need adjustment for the actual size grades a business trades in and the seasonal windows that hit its key species hardest. Cod bought in February and cod bought in May are not the same product, even if the invoice calls them by the same name.
Tracking actual yield against that benchmark is the step that turns assumption into data. A fish filleting log, recording whole weight in against usable weight out on every lot processed, replaces guesswork with a real number over time, and that real number becomes the pricing input going forward rather than the published table.
Finally, the cascade has to be run in full, not collapsed into a single shortcut number. A distributor buying whole round and selling skinless PBO fillet is moving through the WR-to-H&G step, the H&G-to-skin-on-fillet step, and the skin-on-to-skinless-PBO step, and each one carries its own margin layer. Collapsing all three into one blended percentage might save time on the spreadsheet, but it hides exactly where the cost is coming from, and that's the piece of information a pricing desk can least afford to lose.